Car-free Sunday impact on air quality in Brussels / 01 10 2021

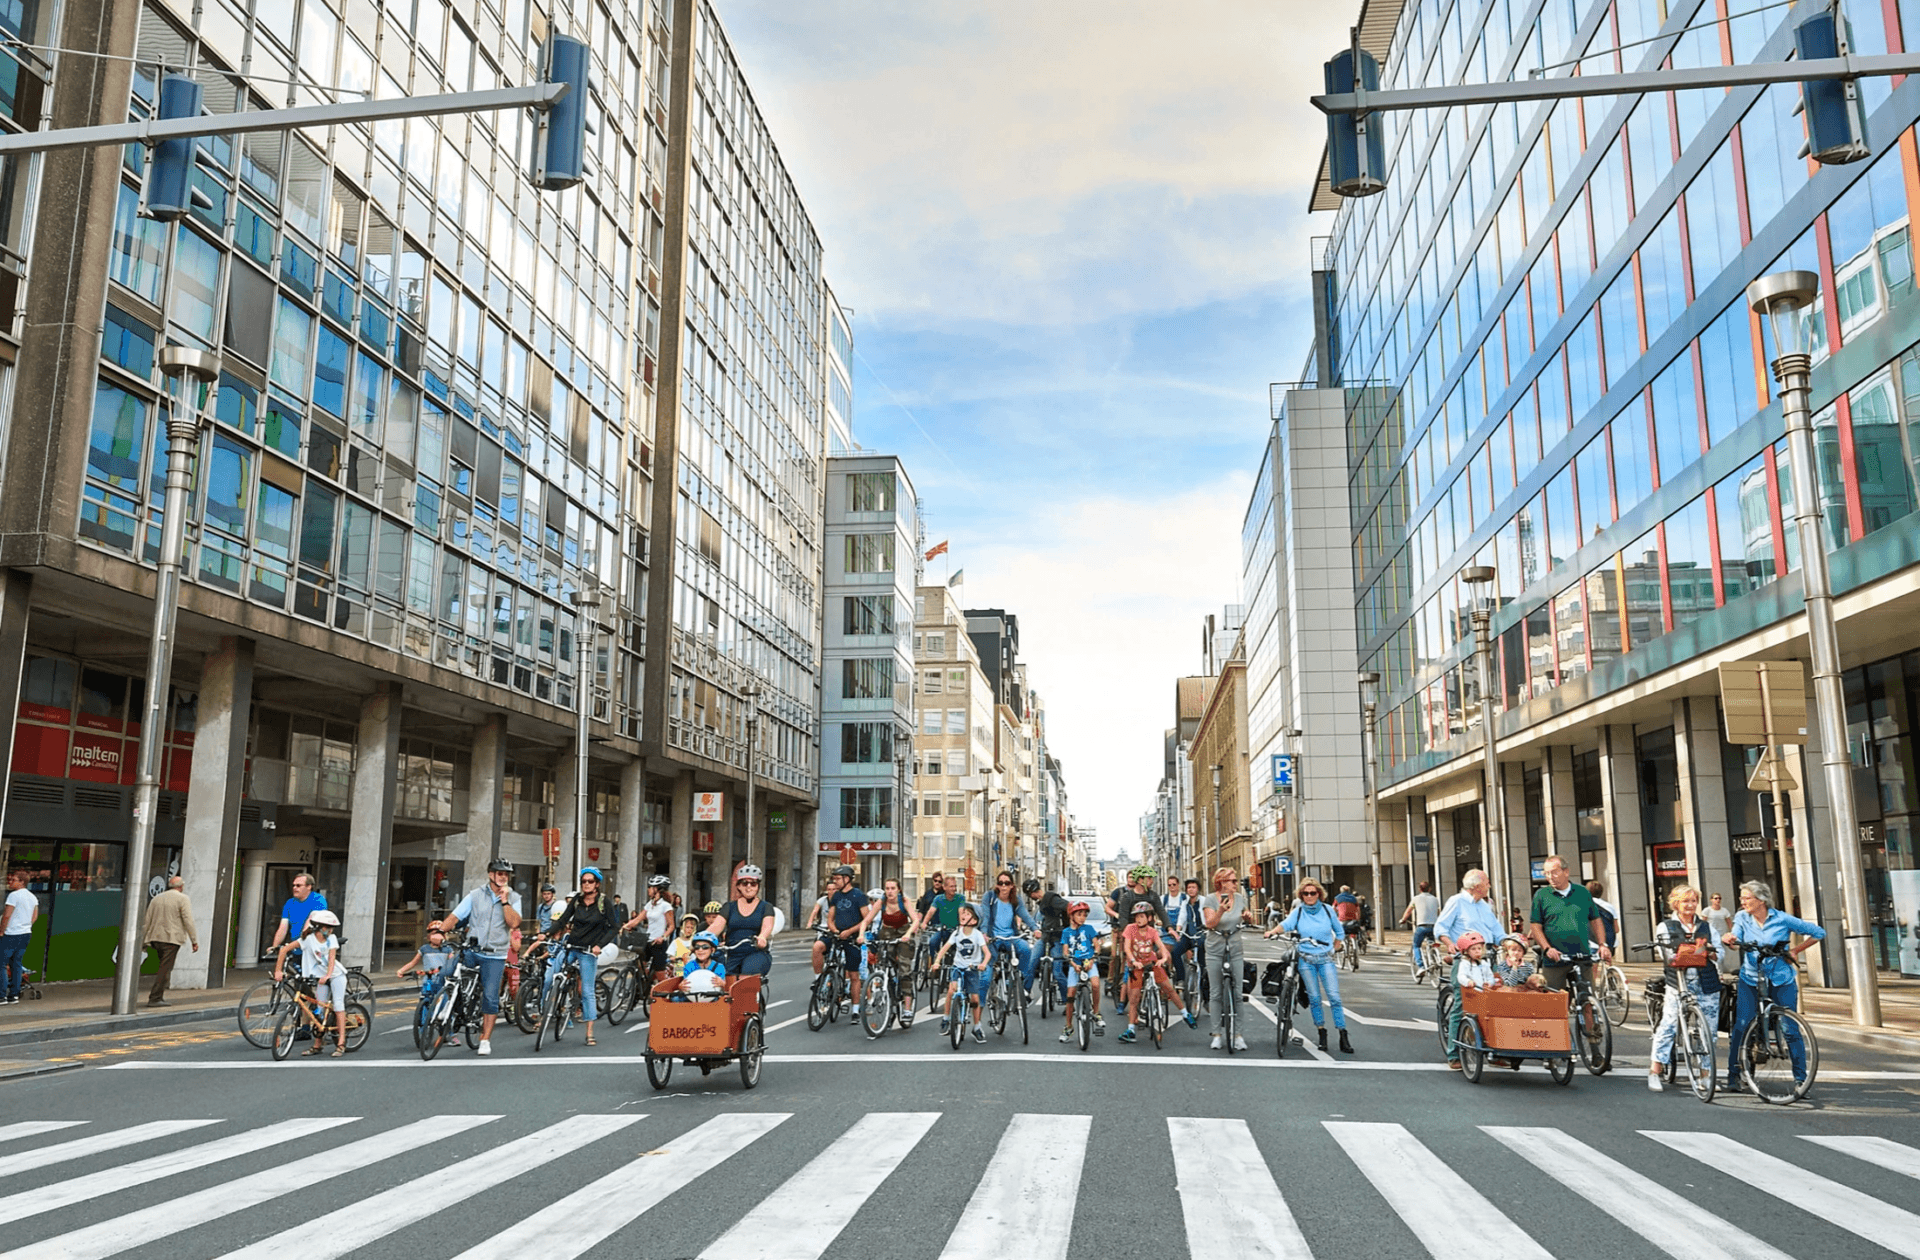
Car-free Sunday in Brussels
1. Context :
Outdoor air pollution is a major public health issue and, according to the WHO, causes 4.2 million premature deaths per year worldwide. Road traffic is one of the primary sources of air pollution in many big cities and agglomeration. For instance, nitrogen dioxide (NO2) and black carbon are mainly emitted by cars in the Brussels-Capital Region. During the last decade, several measures have been implemented to reduce the negative impacts of poor air quality caused by traffic. These measures include the low emissions zone concept and the introduction of mobility week that ends by the European Car-Free Day. This year on Sunday, September 19, the whole Brussels Region was free of traffic between 9:00 and 21:00, - that is an excellent example of European Car-Free Day implementation.
In this Article, the Airscan team compared air quality changes in Brussels starting from 02/05/2021 ending by September 19, when the city was free from cars. In the study concentrations of nitrogen dioxide and PM2.5 were evaluated. Moreover, three different time intervals were accounted:
Average per week – to evaluate the impacts of the mobility week
Average per Sunday – to evaluate overall 24 hours changes during the Car Free Day
Average per Sunday between 9:00 and 21:00 – to see the impact of reduced traffic
2. Results :
2.1. Nitrogen dioxide (NO2)
Molenbeek-Saint-Jean :
The mobility week and the European Car Free Sunday had no positive impact on nitrogen dioxide concentration at Molenbeek-Saint-Jean commune of Brussels. For instance, the average concentration of nitrogen dioxide measured during the car-free day was 22, 89 µg/m3. This value is 46% higher than the average value measured on Sundays for the last 20 weeks. Moreover, a steep concentration rise of 100% was observed during the Car-Free Sunday compared to the Previous Sunday (12/09/2021). More detailed information about nitrogen dioxide evolution in Molenbeek-Saint-Jean is provided in Figure 1.

Figure 1. Evolution of nitrogen dioxide (NO2 ) at Molenbeek-Saint-Jean between Sunday, May 2 and September 19 (car-free day).
Uccle:
The measurements recorded by the station located in Uccle have an identical pattern with the values from Molenbeek-Saint-Jean. In this case, the average NO2 concentration on the day without cars (8.02 µg/m³) is almost twice the Sunday average for the past 20 weeks (4.58 µg/m³). The gas concentration between 9:00 and 21:00 was above 7 µg/m³ on car-free Sunday. While a concentration of 0 µg/m³ was recorded during the same time interval at least 4 times during the past 20 weeks. Finally, all the measured values recorded during the mobility week were significantly higher compared to the values recorded the week before (Figure 2).
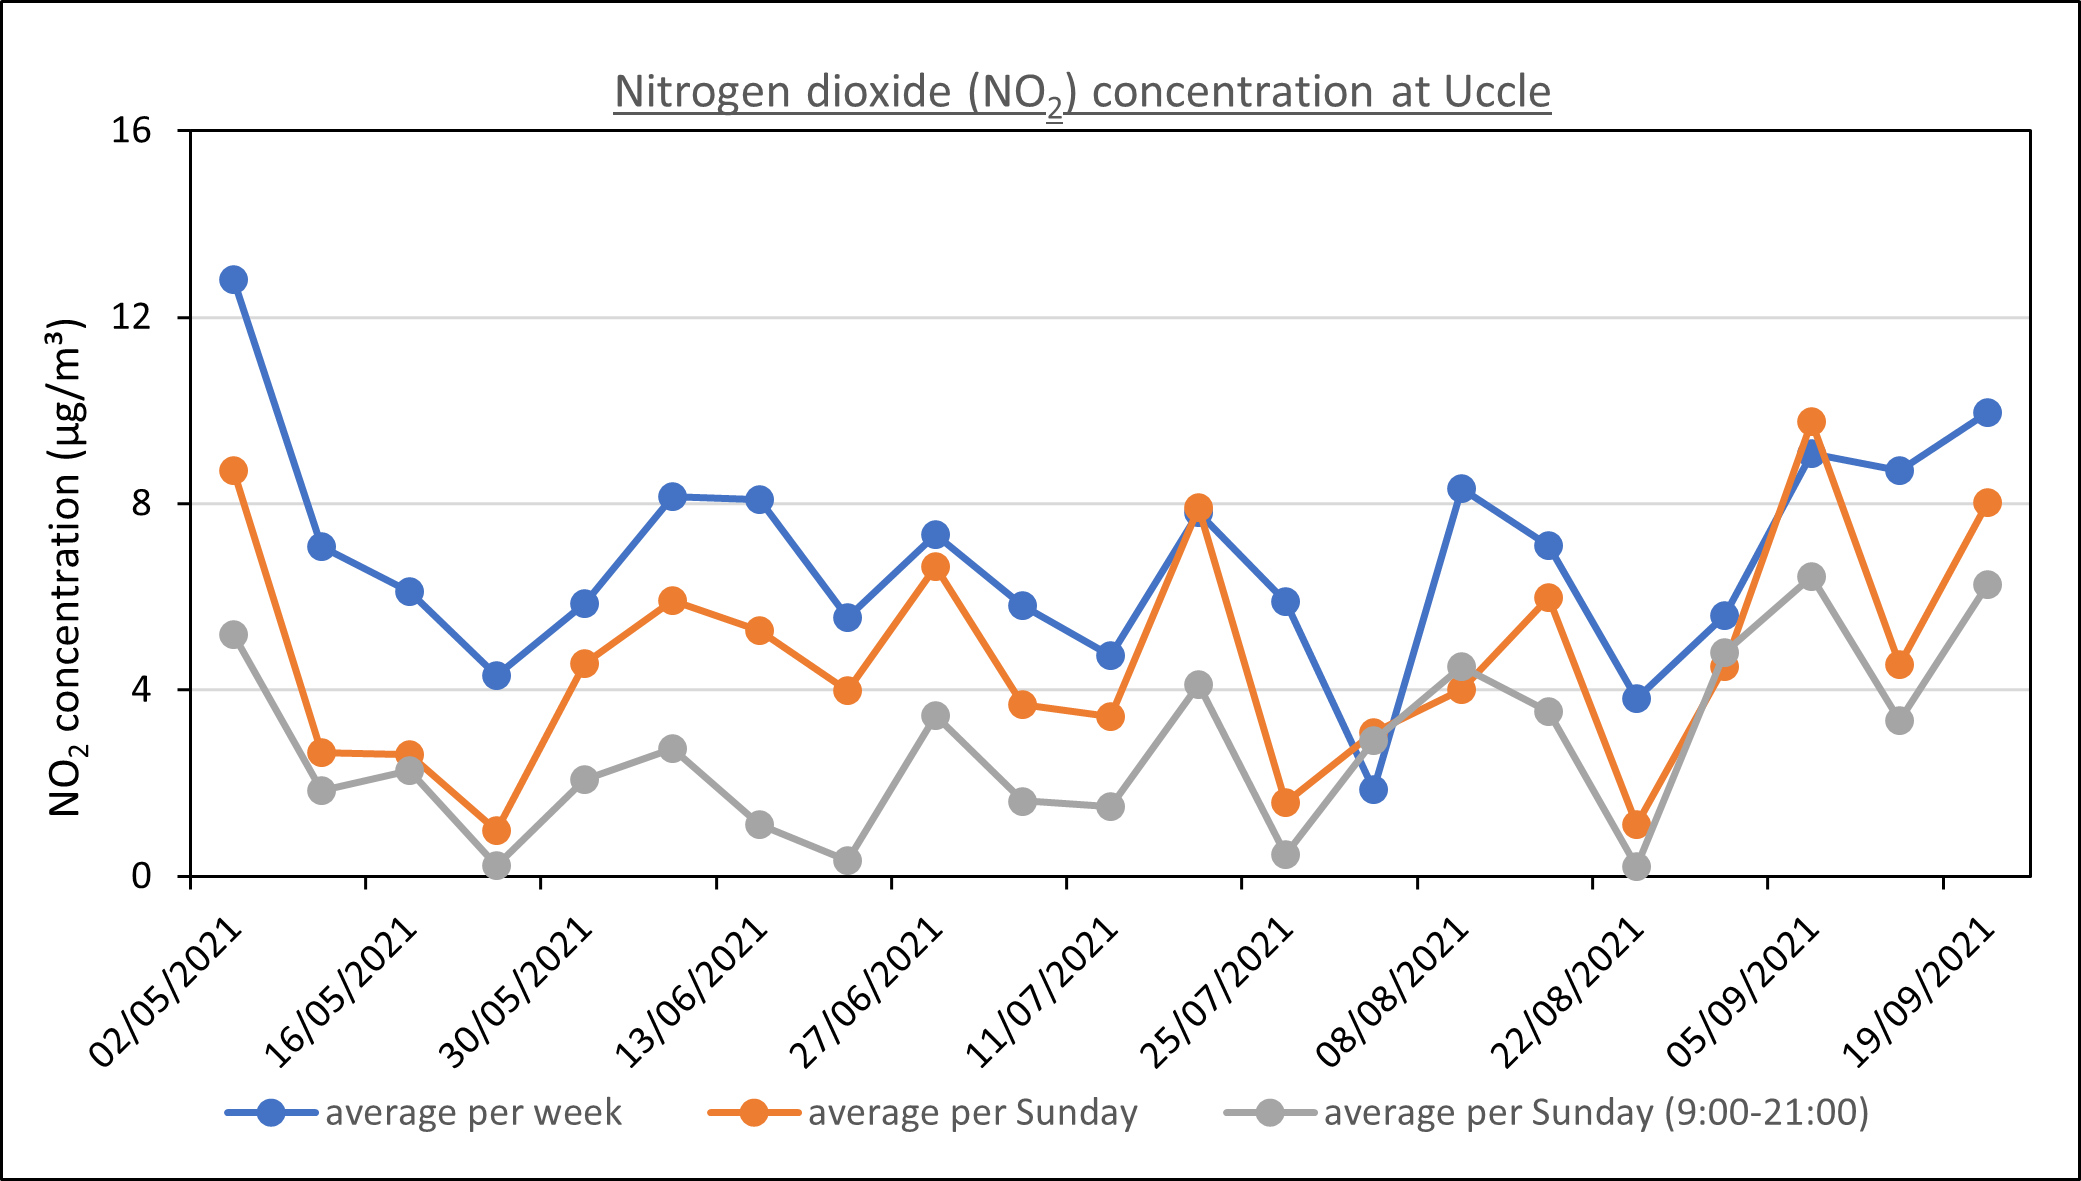
Figure 2. Evolution of nitrogen dioxide (NO2 ) at Uccle between Sunday, May 2 and September 19 (car-free day).
Haren :
The average nitrogen dioxide concentration measured by the station located in Haren was 18.34 µg/m3. This value is 39.6 % higher than the average concentration of nitrogen dioxide gas measured during the last 20 weeks. However, it is important to mention that a minor drop in the pollution levels was observed during the mobility week compared to the previous week (Figure 3). On the other hand, the pollutant concentration slightly increased on car-free Sunday in comparison to the previous Sunday.
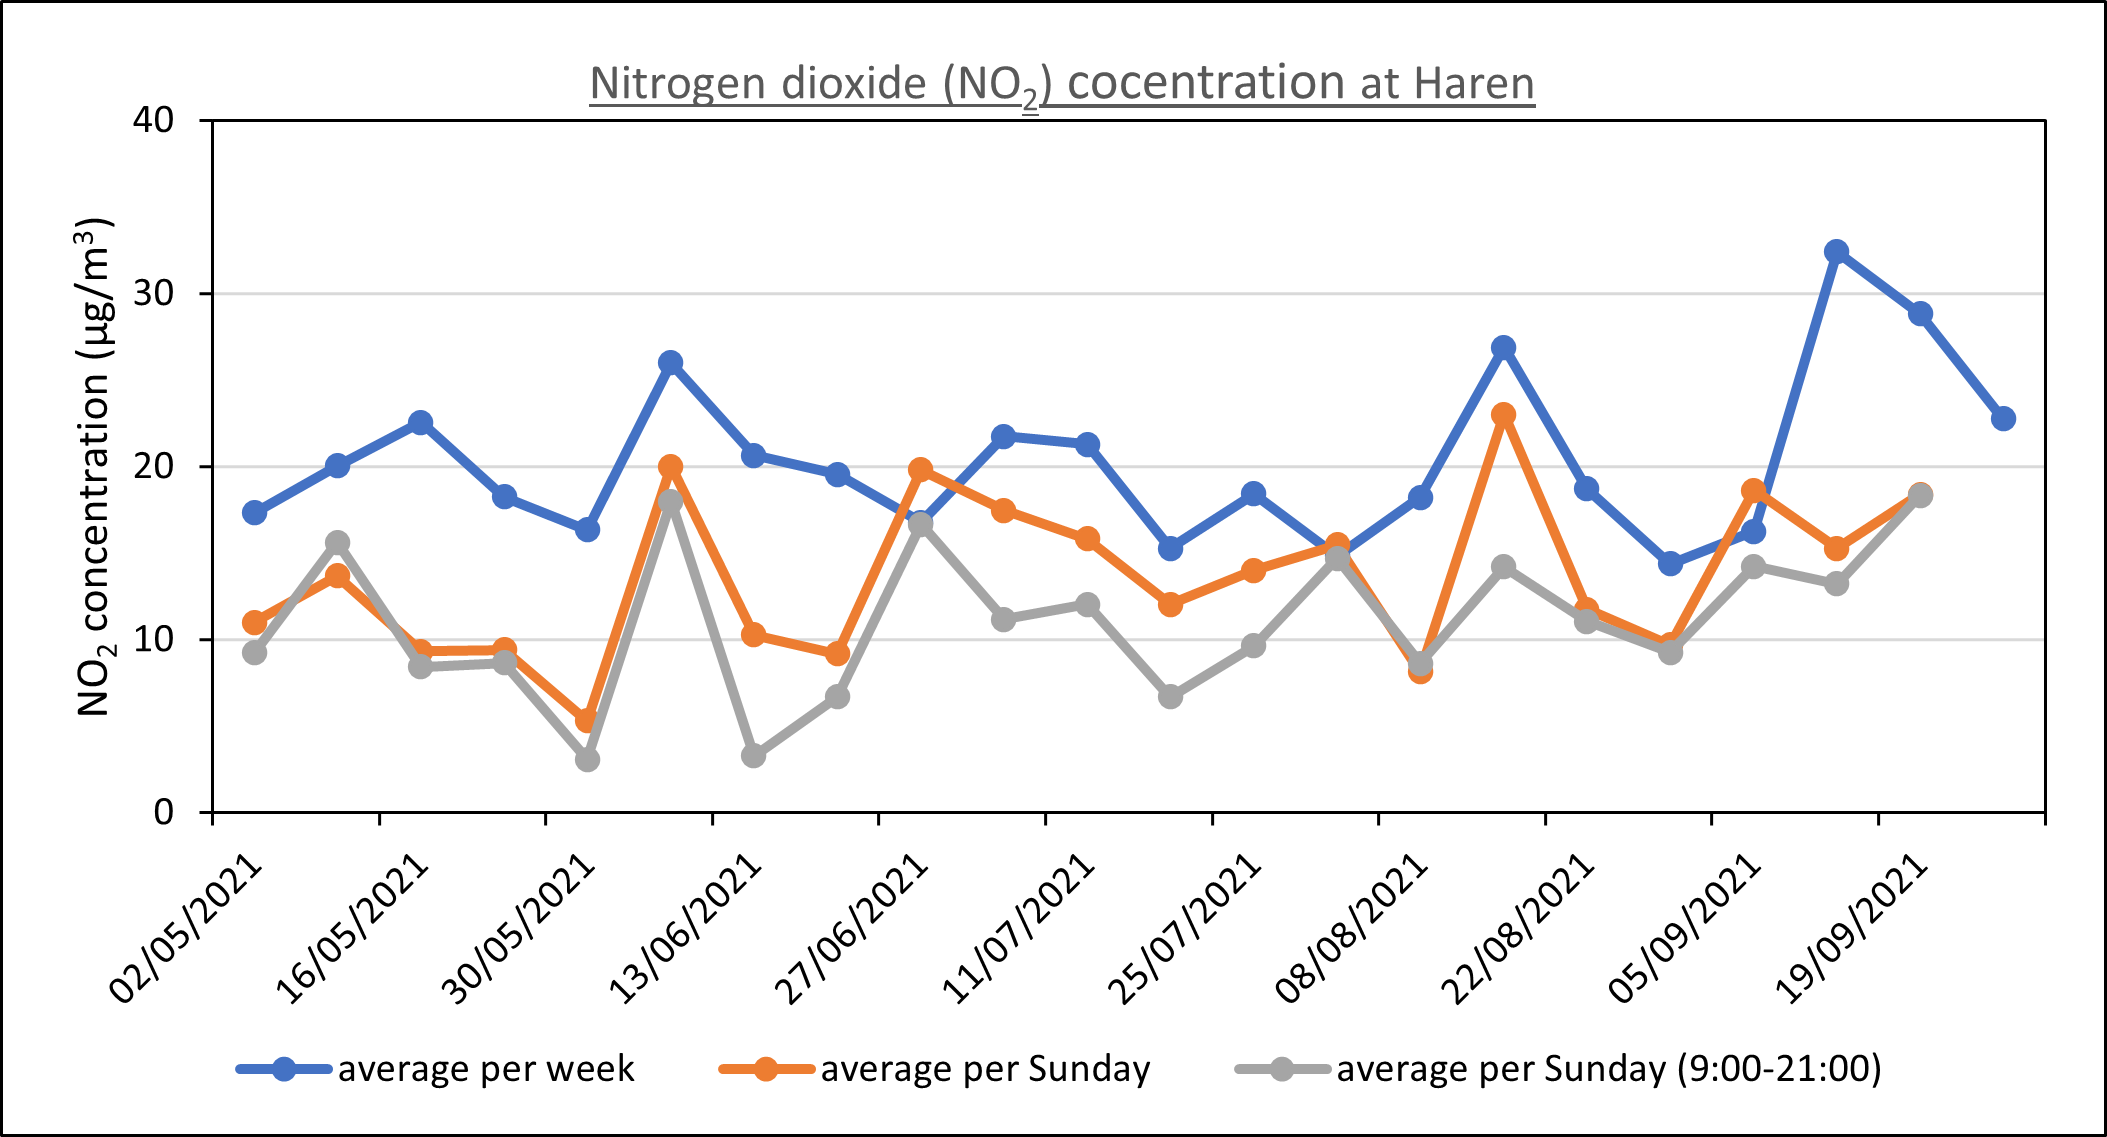
Figure 3. Evolution of nitrogen dioxide (NO2 ) at Haren between Sunday, May 2 and September 19 (car-free day).
Arts-Loi :
Arts-Loi is the only location where a positive trend in nitrogen dioxide reduction was observed. For instance, the average concentration on car-free Sunday between 9:00 and 21:00 was 10 µg/m³ (Figure 4). This value is the absolute minimum recorded by the station during the last 20 weeks. Moreover, the average concentration measured on Sunday (17 µg/m³) was 35% lower comparing to the past 20 Sundays’ average. Finally, daily nitrogen dioxide measurements at this measurement location show the highest background concentration in Brussels.
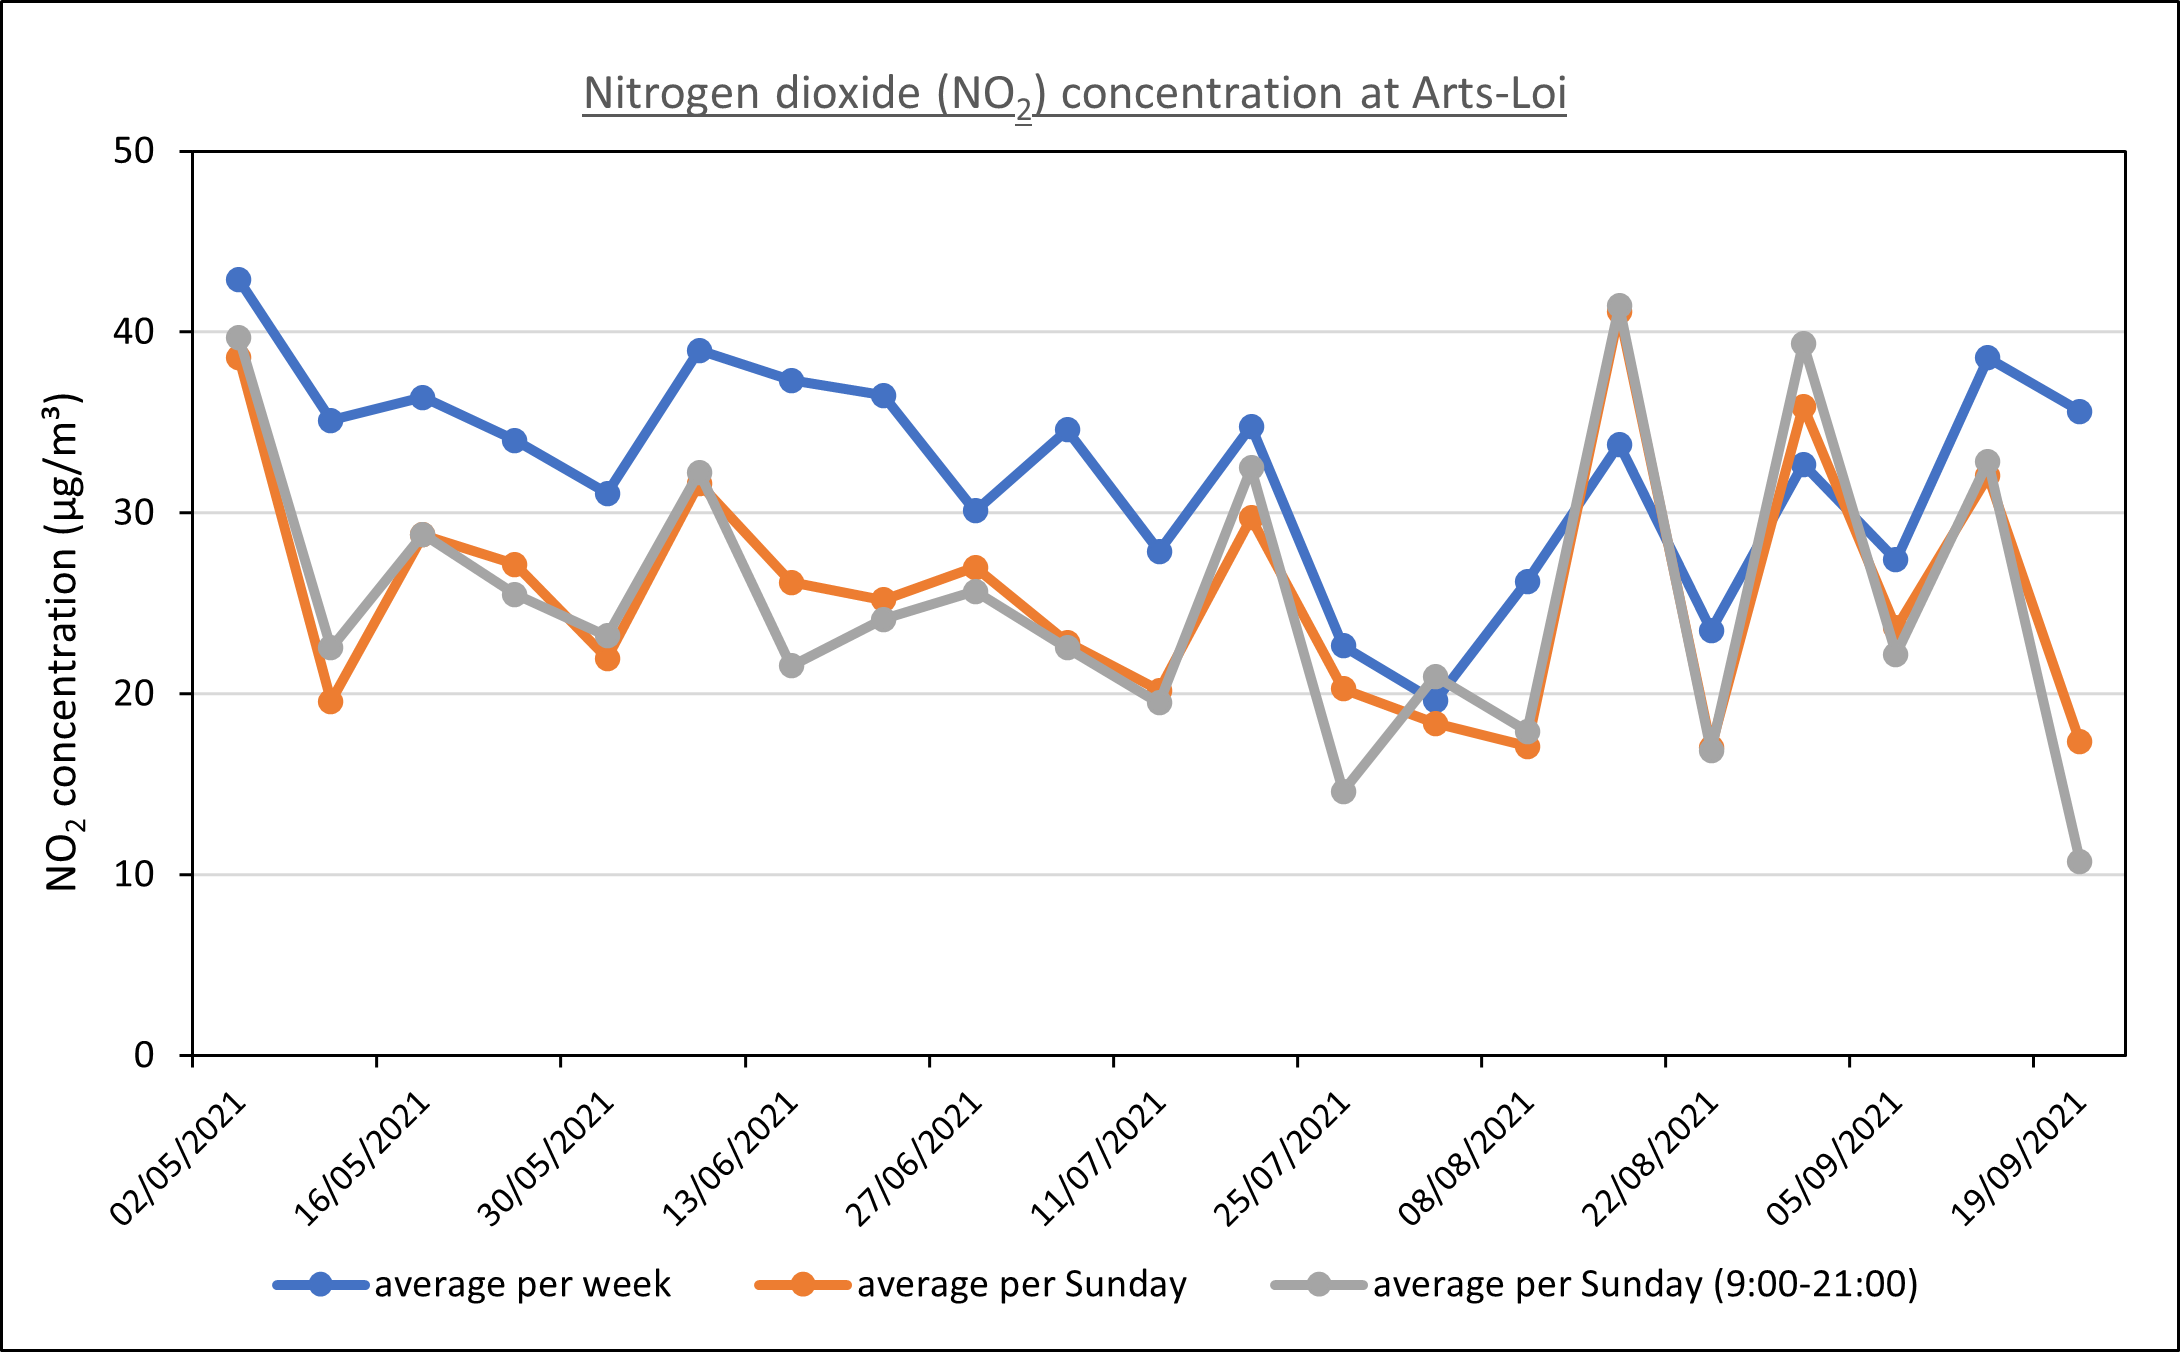
Figure 4. Evolution of nitrogen dioxide (NO2 ) at Arts-Loi between Sunday, May 2 and September 19 (car-free day).
2.2. Particulate matter (PM 2,5)
Molenbeek-Saint-Jean :
At the Molenbeek-Saint-Jean station, an average PM2.5 concentration of 15.80 µg/m³ was measured against an average concentration of 8.29 µg/m³measured on Sunday during the past 20 weeks. Moreover, the pollutant concentration during the mobility week was significantly higher comparing to the values measured between 11/07/2021 and 05/09/2021 (Figure 5).
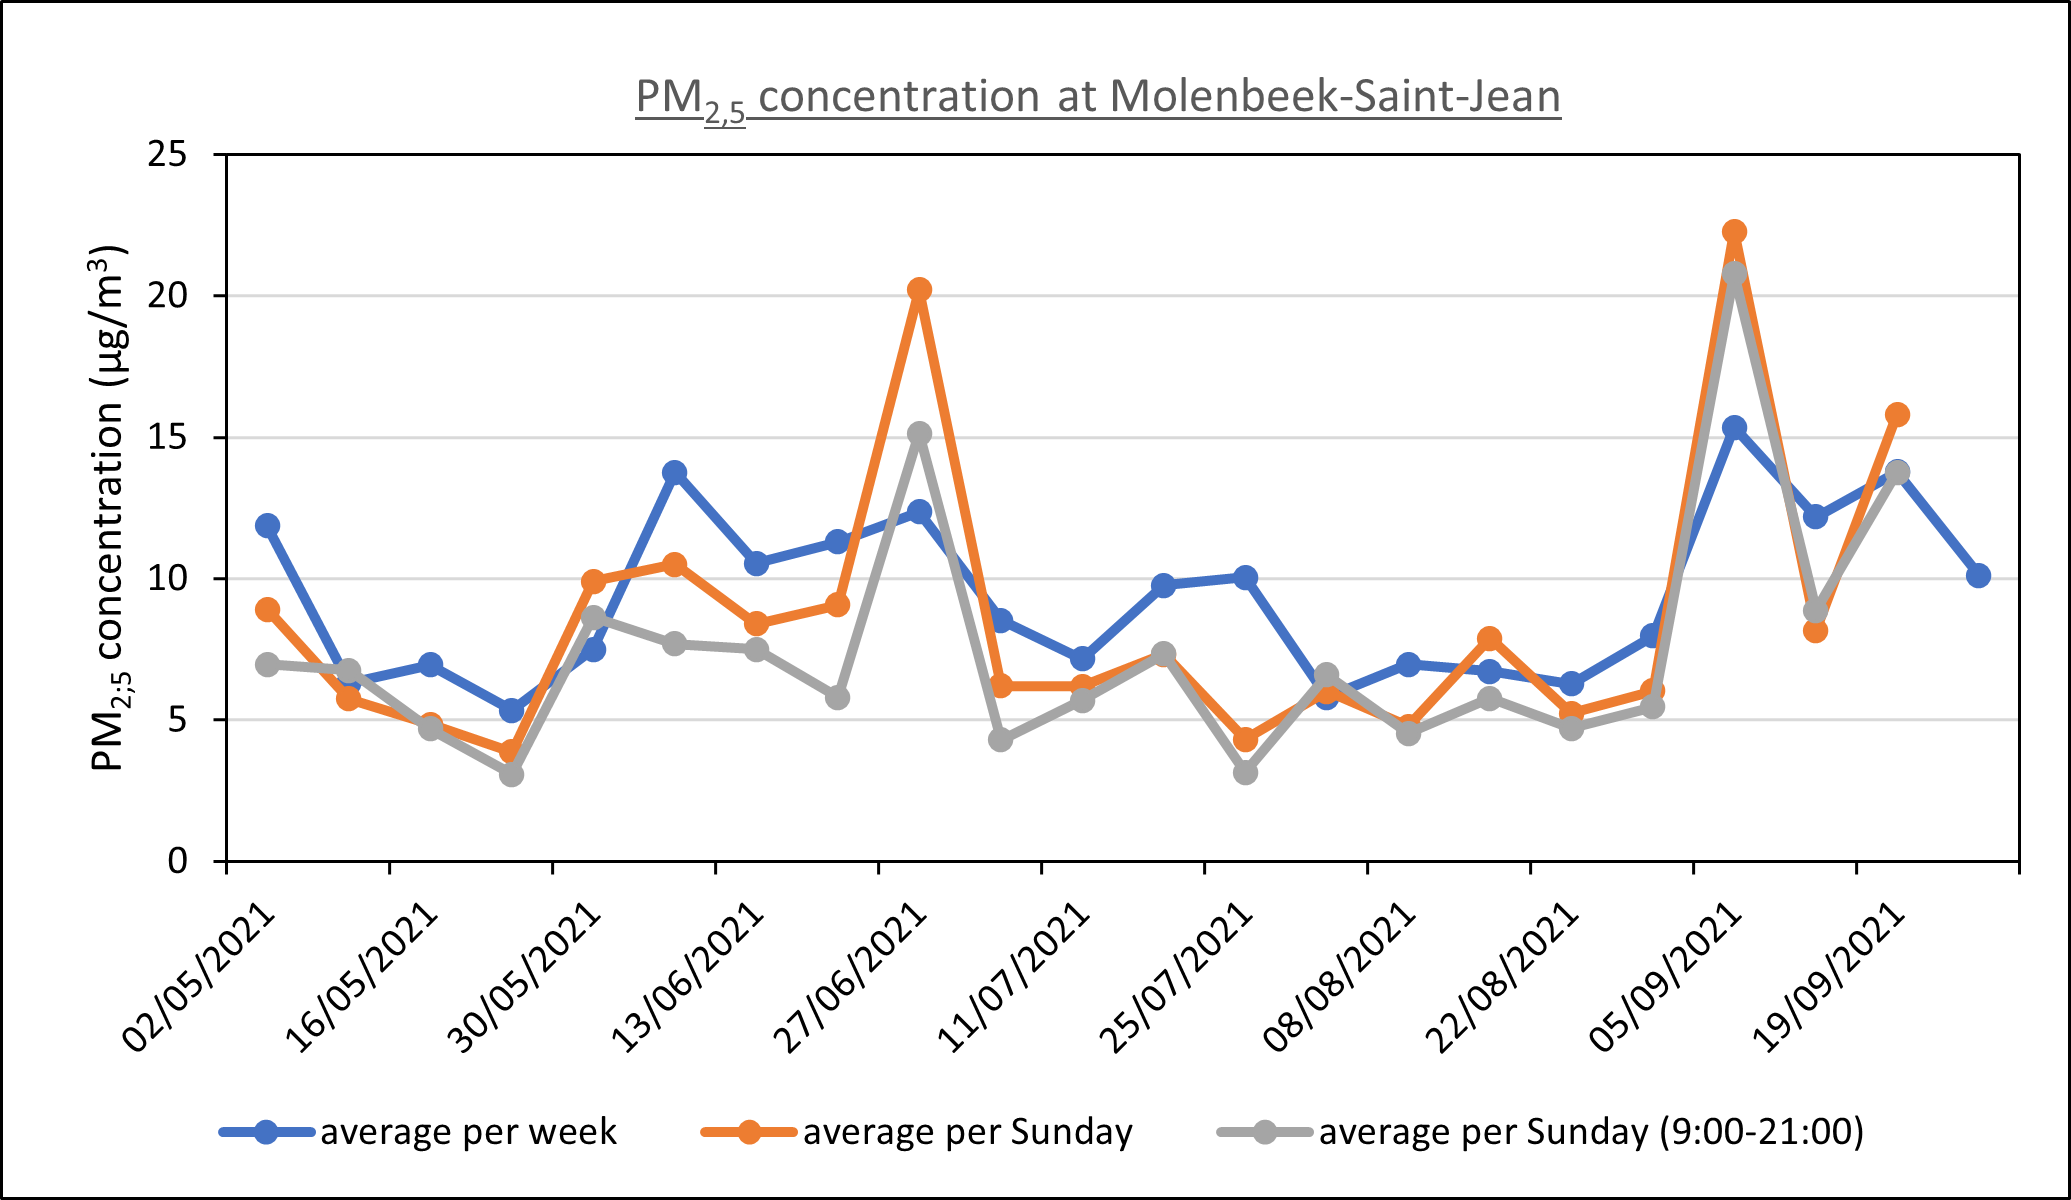
Figure 5. Evolution of PM2.5 at Molenbeek-Saint-Jean between Sunday, May 2 and September 19 (car-free day)
Uccle :
For Uccle, an average PM2.5 concentration of 15.32 µg/m³ was measured. This value is almost twice bigger than the average concentration of 7.83 µg/m³ detected on Sundays during the last 20 weeks (Figure 6). There was no positive influence of the mobility week and car-free Sunday on the pollutant concentration observed.
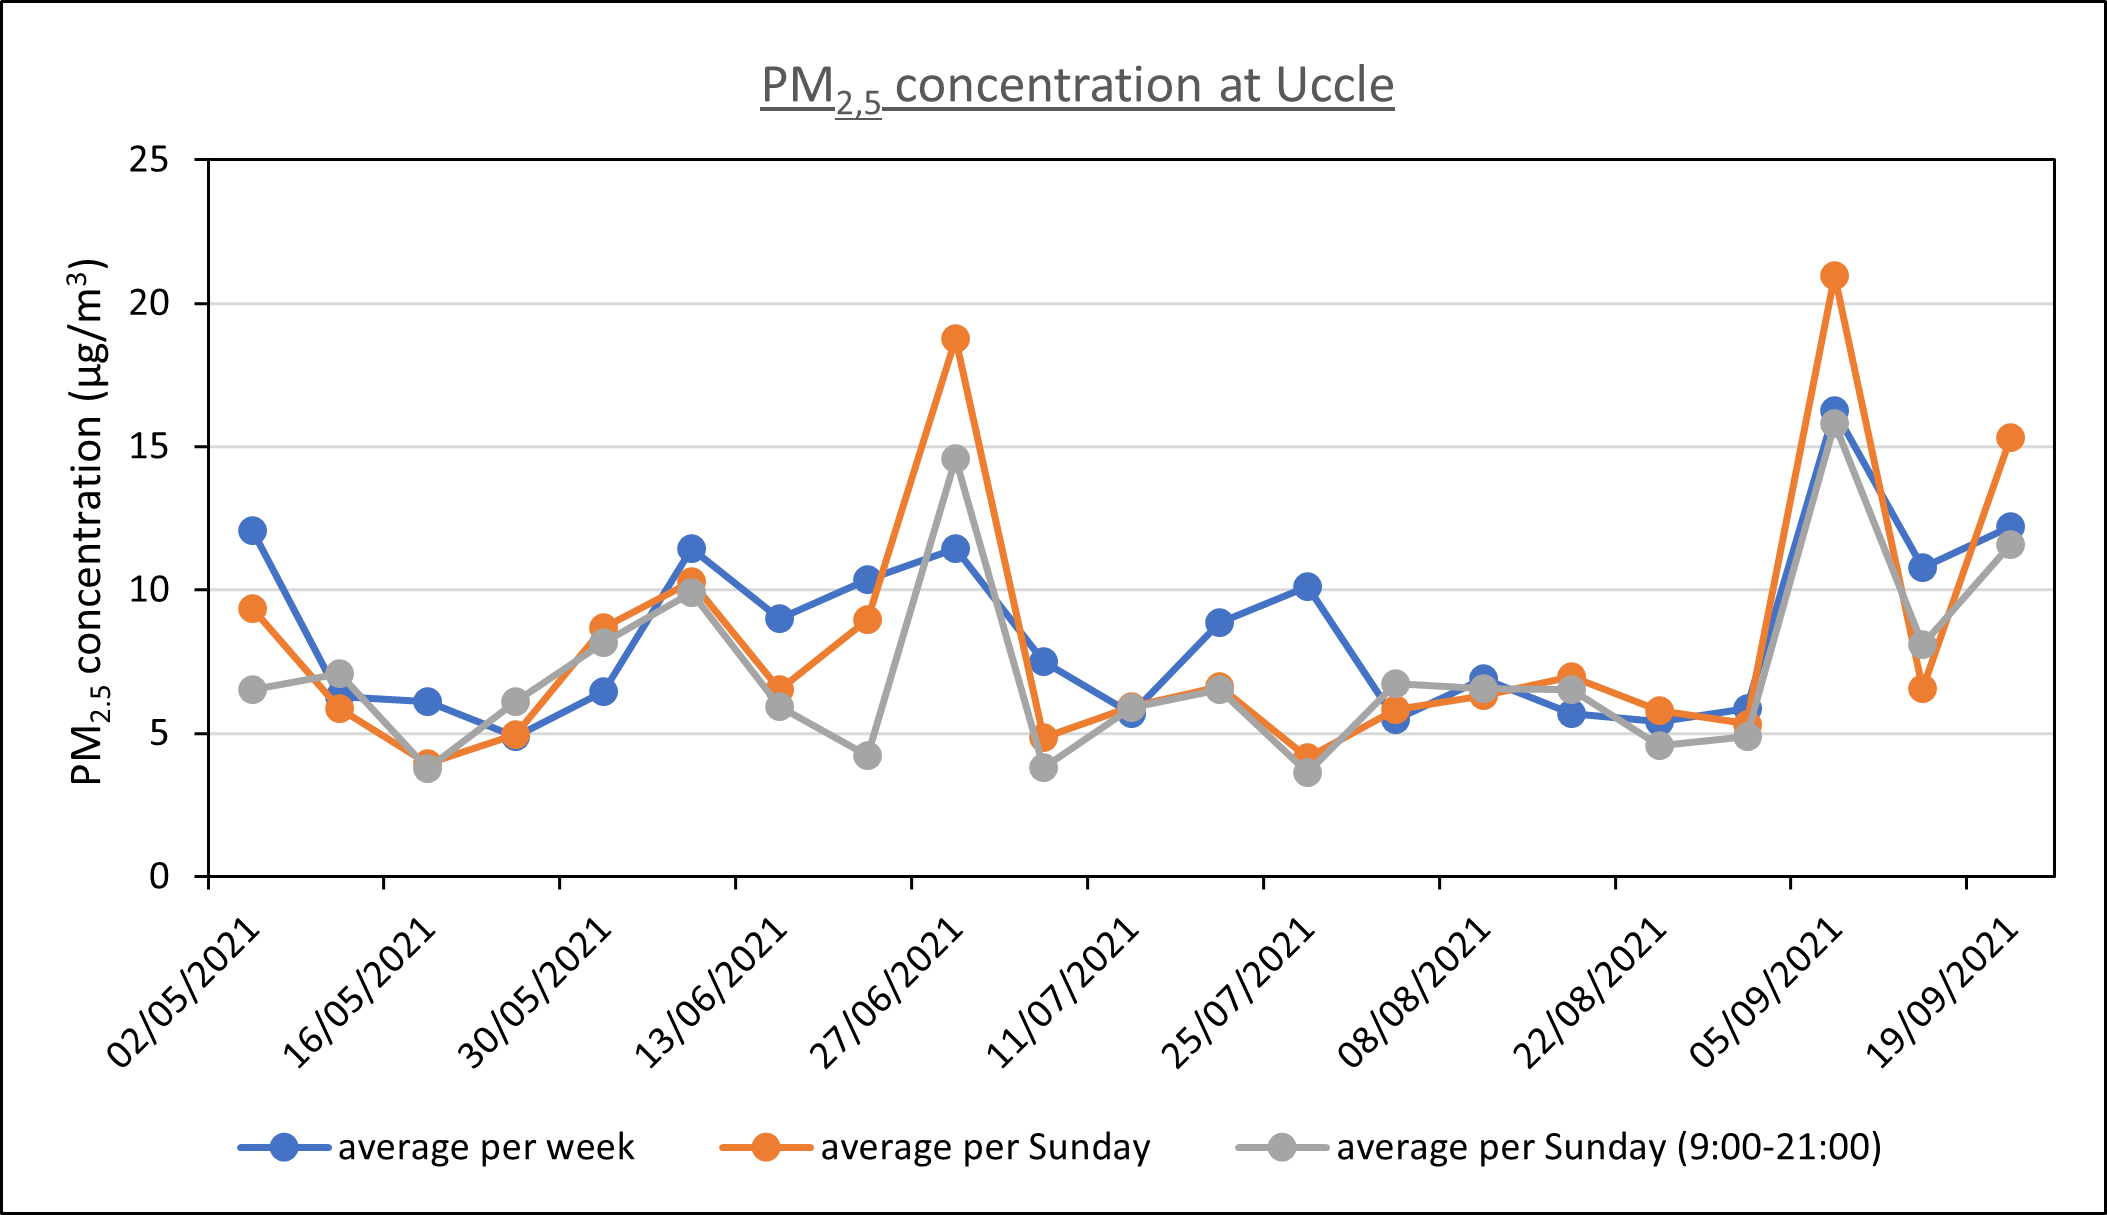
Figure 6. Evolution of PM2.5 at Uccle between Sunday, May 2 and September 19 (car-free day)
Haren :
An average PM2.5 concentration of 16.78 µg/m³ was measured at Haren station. Identically to the previous case, this concentration is almost twice the average concentration of 9.61 µg/m³ observed on the last 20 Sundays (Figure 7). Identically to the first measurement locations, no improvement in PM reduction was observed. Moreover, all the stations have identical pollutant evolution trends that can indicate the dominance of natural and transboundary PM pollution sources in Brussels.
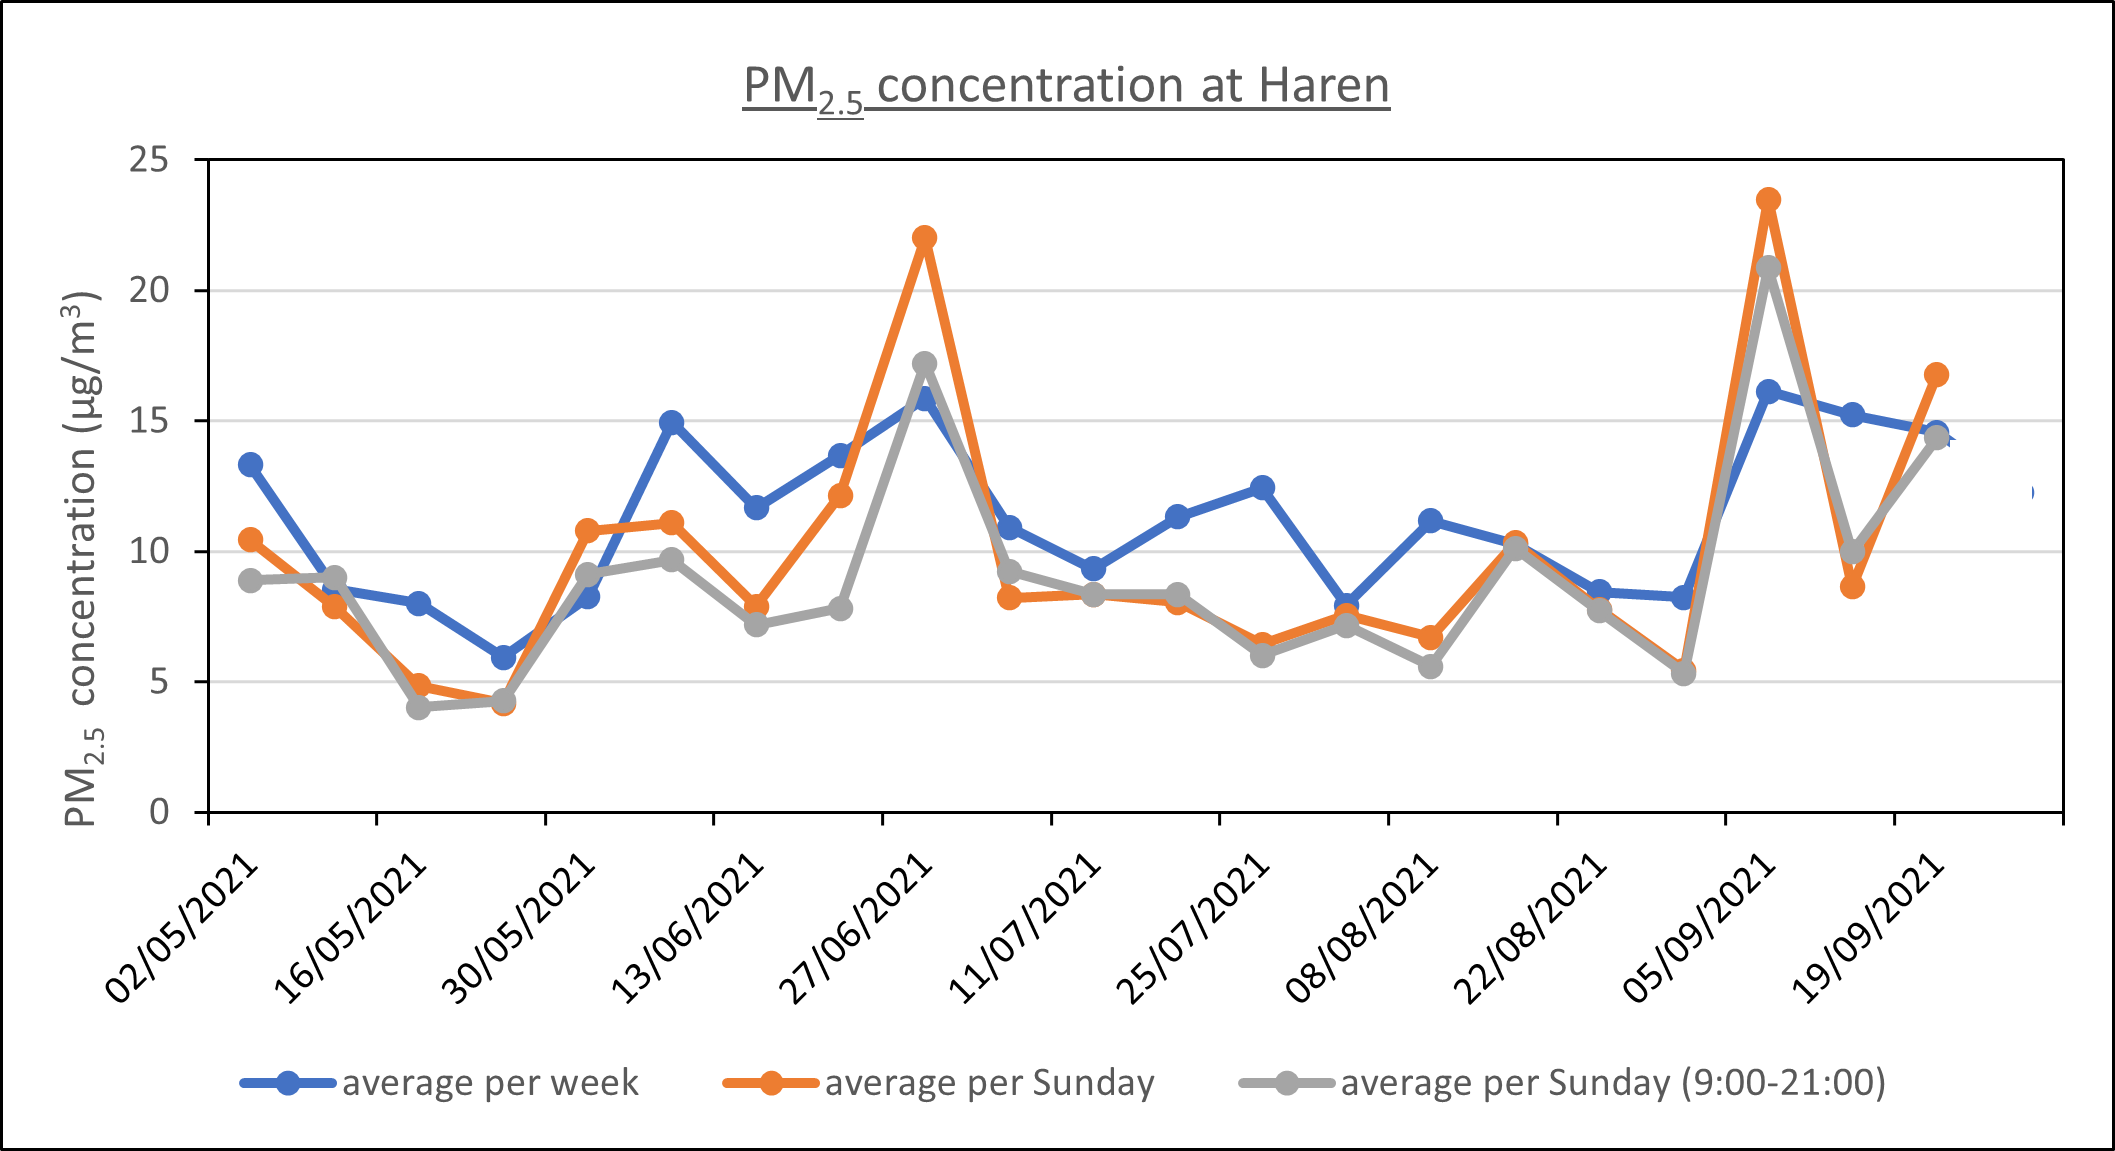
Figure 7. Evolution of PM2.5 at Haren between Sunday, May 2 and September 19 (car-free day)
3. Conclusion :
Unfortunately, it is not possible to make a solid statement about the impact of the European Mobility Week and the European Car-Free Sunday on air quality conditions in Brussels. On one side, nitrogen dioxide concentration dropped by 40 % in the station located at Arts-Loi in Brussels. This station is heavily exposed to air pollution due to traffic flow passing through the location. And of course, the car-free day had a positive impact on the gas concentration as long as the measurement station had no direct exposure to the pollution source. On the other hand, NO2 concentration increment was observed in Molenbeek-Saint-Jean, Uccle and Haren – locations located remotely from NO2 hotspots.
According to the Belgian Interregional Environmental Unit (CELINE), it is difficult to estimate the impact of the car-free day on nitrogen dioxide concentration. The report says that the weather conditions, wind direction, the complex chemistry of NO2 and other parameters can significantly affect actual concentrations. Moreover, NO2 lifetime in the atmosphere varies from hours to a few days depending on many factors. Therefore, one day with no traffic in Brussels streets would not always be sufficient to observe a decrease in NO2 levels. On the other hand, the interpretation of PM concentrations measured by 3 different stations showed that the natural sources and dust storms have more impact on fine dust particles concentration in Brussels compared to traffic.
Although there was no direct impact on air quality observed in Brussels, this day is a very good practice to raise awareness around air quality. In such days more people realise the importance of shifting towards green mobility. Moreover, it is always more pleasant, relaxing and social to spend time outdoors when the city streets are no longer occupied by cars.